

Abstract:
Purpose: The purpose is to investigate the moderating effects of brand equity in the link between value expressiveness (VE) and social adjustment (SA) attitude function regarding the consumption of counterfeit products by females who knowingly buy them in the setting of Pakistan.
Design/methodology/approach
To engage in this study, female residents of Pakistan’s urban areas were chosen, making the sample of this research 100 consumers in total.
Analysis
It has been found that brand equity moderates both the relationship such as the relation between VE function and CPC and between the SA function and CPC. Moreover, the inclusion of the brand equity variable improves the R square of the models.
Keywords: counterfeit product, value expressiveness, social adjustment, brand equity, Clothing industry
Introduction
Low-quality products that imitate the original products are counterfeits. When it comes to dependability and durability, counterfeit products are at the absolute bottom of the chain (Lai and Zaichkowsky, 1999). Over the past ten years, original product counterfeiting has increased. counterfeit goods with trademarks that are nearly identical to those of genuine goods lead to serious financial and social problems that endanger consumers’ lives, generate financial chaos, and erode consumer confidence in branded goods (Kay, 1990; Tom al., 1998). According to Lai and Zaichkowsky (1999), replicas are unlicensed, cheap imitations of well-known brands that are typical of inferior quality.
The final participant in fraudulent transactions is a customer who may play the victim or the willing accomplice (Cordell et al., 1996). The consumer becomes a victim when he purchases a fake good while believing he is purchasing an authentic one. The end user is aware that the product is a copy of the original product when they are an eager collaborator. Some people buy a fake product to get useful features, while others do it for prestige appeal. When a customer acquires a replica on purpose to satisfy his need for status, he separates the quality and characteristics of the original product and instead obtains representations of its features and functions (Grossman & Shapiro, 1988). The value expressive (VE) and self-adjustive (SA) functions of attitude are the two that sway consumers to purchase counterfeit goods. People are more concerned with their self-image in front of others according to the VE function of attitudes. The VE function reveals a person’s traits, perspectives, beliefs, and sense of self (Katz, 1960; Snyder and DeBono, 1989). Consumers’ VE attitude functions towards brands are influenced by distinctiveness, status, and social individuality. These interrelated dynamics show how consumers want to maintain their social standing.
Conformism and the SA function of attitude are related (Maioand Olson, 1995). Achieve social approval, refers to a person’s association or disassociation with particular people or groups of people (Smith et al., 1956). If consumers have both of these views, they are willing to purchase branded counterfeit goods to advance their position, social identity, and acceptance. These customer behaviors eventually demonstrate their understanding of brand awareness and brand equity, which are two related concepts.
Some studies look at how likely people are to purchase fake goods to make suggestions for effectively combating the counterfeiting issue. Not all consumers purchase fake goods. Everything is dependent on how consumers feel. The VE and SA functions of attitude represent consumer self-image consciousness and the drive to form or break relationships with others to maintain social identity or status. They prefer to utilize branded products for this reason, but if the brand is out of their price range, they will turn to knockoffs. These consumer attitudes eventually show how they view brand equity, therefore it is important to assess the value of VE and SA attitudes towards the consumption of counterfeit goods with the moderating effect of brand equity in the market.
The aim is to investigate the moderating effects of brand equity in the link between value expressiveness (VE) and social adjustment (SA) attitude function regarding the consumption of counterfeit products by females who knowingly buy them in the setting of Pakistan. Therefore, the researcher developed the following research questions:
How do brand equity influence the VE and SA attitude function linked to CPC?
The study focuses on how the VE and SA functions of attitude affect the consumption of counterfeit goods because they are present in the majority of consumers, particularly females. Additionally, it is investigated whether or not brand equity reduces the impact of VE and SA attitude functions on the consumption of counterfeit goods.
The limitations of this study include its exclusive focus on consumers of counterfeit goods, its collection of information from female buyers of counterfeit clothing labels, and its restriction to urban consumers in Pakistan.
The research that is now available shows how important social recognition, social image, and status are in life. It has specifically increased consumers’ aversion to knockoffs of well-known brands. The social standing of the VE and SA functions influences people to buy counterfeit goods.
Review from Literature
Many researchers have examined the elements that influence consumers’ attitudes about buying counterfeit goods. Lai and Zaichkowsky (1999) defined counterfeit goods as illegal copies that are frequently of worse quality than the original luxury items. The paradigm that was used to explain why customers buy counterfeit products and their views about them depends on a variety of variables and circumstances. As a result, the vast majority of research in this area compares the effects of various factors that affect the purchase of counterfeit goods. The influence of product pricing, awareness of the black market, product standards, prior purchase habits, and buyer attitudes toward counterfeit luxury goods are all factors that have been examined in earlier research on the topic.
History of Counterfeiting
As the “second oldest profession,” counterfeiting is a long-standing practice that predates civilization. According to Phillips (2005), counterfeiting has a long history. In the year 27 BC, wine traders from France marketed inexpensive alcoholic beverages as expensive imports from Rome. Pliny the Elder, a Roman philosopher and military commander (23–79 AD), mentions in his writings the popularity of fake coins as collector’s items in Roman society (Chaudhry and Zimmerman, 2013).
Old cases of replication were reported in Egypt and Babylon where clergymen engraved writings of former civilizations on monuments to make profits (Hopkins and Turnage, 2003). During the period of the 1800s, the American stylish class who could not afford to travel to Europe asked tailors and boutiques to replicate the fashion of Europe for them. Some of the designers retorted to this mania by legally vending their designs to the shops, while other designers opted to sue the imitators. In 1923, several Parisian artists instituted the “Association La Défense Les Arts Plastique et Appliqués,” intending to apply and encourage copyright rules (Sterlacci and Arbuckle, 2017).
In the present era, it has become toughest to determine the effect of counterfeiting and its market size due to an absence of enough reliable information (OECD, 2007). The evidence is in the large figures, and it is hard to grip them entirely, but certain indicators disclose the significance of the matter. Kaikati and La Garce (1980), Grossman and Shapiro (1988b), and other investigators researched unauthorized duplication of copyrighted content and counterfeit products using a marketing perception. The early studies mainly focused on the supply aspects (such as Chaudhry and Walsh, 1996; D’Amato and Papadimitriou, 2013). The anti-counterfeiting regulation and governmental determinations have not generated the expected results and failed to confront the issue. Then in the 1990s, researchers instigated their interest in the demand aspect (Albers-Miller, 1999; Bloch et al., 1993; Chakraborty et al., 1996), yet, it is still required to understand some uncovered consumer behavior.
Counterfeit Consumption
The counterfeit business is booming because there is a high demand for counterfeit items (Bamossy and Scammon, 1985). Consequently, consumers perform a crucial part in these transactions (Xiao and Nicholson, 2010), and copiers every time look for novel methods to please the consumer (Penz et al., 2012). Several decisions related to purchasing are influenced by the belief that things communicate prestige, and the “happy few” have attracted the interest of scholars (Veblen,1899). Aside from functional utility, products that provide power and wealth via possession are classified as luxury goods (Grossman and Shapiro, 1988b). According to Dubois and Duquesne (1993), a brand or logo and the image related to it are frequently employed to influence the spectator and are commonly more appreciated by customers than the commodity itself. Some customers choose counterfeit products for symbolic purposes. Cheung and Prendergast (2006b) in their study reveal that customers buy counterfeits as a trial version before purchasing the original brand, yet the negative impacts on the actual brand never exceed the positive impacts (Eisend and Schuchert-Güler, 2006). Whereas both the supply side and demand side of replicating the original brand are significant and intriguing, we focused on the demand side in this study because the supply side is not as pertinent to the issue under analysis. We then examine the two functions of attitude that impact people’s participation in counterfeit consumption. A better understanding of the elements that influence such consumption might assist marketers and policymakers in addressing the procedures and phases that consumers go through when dealing with counterfeits, as well as curtailing such activities by targeting explicit aspects of consumer conduct.
Consumer Attitudes towards Counterfeits
Several former researchers have looked into the influence of customers’ views, feelings, and perceptions about counterfeit and luxury commodities on purchasing behavior. The previous study provides the methods and conclusions, and that are used to elucidate a basic outline for counterfeit purchasing (Eisend and Schuchert, 2006). The former studies reveal the two attitude functions (SA and VE) are chief drivers in identifying consumers’ buying conduct for counterfeited and genuine superfluity products. They are influenced by product configuration and product demand through which products can meet important societal and private goals (Snyder and DeBono, 1985). As a result, the two functions of attitude can account for customers’ purchasing of counterfeit products. Alternatively, differences in buying preferences between these two attitude functions might indicate some of the reasons why buyers acquire counterfeit superfluity products. Wilcox et al. (2008) split contributors into clusters grounded on two distinct attitude functions i.e. VE and SA to conduct their study on counterfeit products.
Value-Expressive and Social-Adjustive Attitude Functions
Smith et al. (1956) raised a question regarding people’s opinions and stated that it is the beginning stage of the functional approach to attitude. Moreover, researchers proposed in their studies that people grasp and state certain attitudes since they obtain psychological advantage from doing so and that the kind of advantage differs from person to person. They presented attitudes in accord with psychological needs (Smith, 1947; Sarnoff and Katz, 1954; Smith et al., 1956; Katz and Stotland, 1959; Katz, 1960; Katz 1968). When a person is allowed to display his fundamental ethics and outlooks, they act as VE functions. The next one is a SA function that permits the person to robust into communal states and act in modes suitable to a variety of reference groups. These functions of attitudes in the consumers towards a certain product can be noticed on a different level. Shavitt (1989) has demonstrated that the consumers of luxury brands might have the only SA function, VE function, or both. When a person possesses SA function, then he buys luxury manufactured goods mostly, since the luxury product is a sign of individuality and expresses a favorable and high-standard picture to other people. Therefore, recognizing the attitude of consumers’ function to luxury brands is vital to identify their causes to buy the imitate brands and forecast the circumstances in which their attitude will transform (Shavitt, 1989). This inference is possibly essential for brands to expand their marketing tactic for their consumer divisions.
The functional theories are associated with the numerous functions of attitudes, and consider the main factors of the link between attitudes and conduct (Shavitt 1989). More explicitly, to sustain the social objectives of maintaining a certain appearance in society, consumers are more appealing to the product image and product quality when their attitude dole out mostly a SA function (Snyder and DeBono (1985). In contrast, when consumers are extra receptive to messages that endorse built-in features of products, for instance, reliability of the product, they hold the attitude which is dealing with a value expressive function since those messages are further interpretable regarding their fundamental values and outlooks (Wilcox et al., 2009).
The attitudes of consumers in purchasing luxury products for image drive out as a SA function, while consumers’ attitudes toward luxury brands for the quality of the product are presented as a VE function. So, it is expected that customers possess a principal SA attitude, concerned more about the brand and the unique representation of the luxury product. Customers with key-VE attitudes will prefer counterfeit luxury products as these counterfeit products copy not only the exterior but also imitate the design of the function of the product, particularly those vast middle series brands who manufacture counterfeit products with high value and durability. These kinds of counterfeit products satisfy the consumers’ demand who can’t pay for luxury brands and want to have the same high-quality products. In contrast with strictly unlawful counterfeit products, these imitate luxury products possess their brand, some counterfeit products are even well-known national brands that are not in brand name violation and are more satisfactory to the common public on an ethical level.
The Marketing Science Institute (MSI) connotes that brand equity can be defined by consumers as both a financial asset and as a set of positive links and conducts” (MSI 1989). While Farquhar (1989) argued that brand equity to a purchaser follows from a positive assessment of, or demeanor toward, the branded item, Keller (1993) inferences that consumer-based brand equity emerges from a better deferential reaction to the company’s showcasing endeavor.
Brand equity can likewise be seen as the aftereffect of buyer conduct, that is to say, it is the purchaser’s one-sided conduct toward brands with specific positive brand affiliations. The differential reaction alluded to by Keller is said to result from the buyer’s brand information memory structure, which comprises a brand image and brand awareness. Keller sees the brand image as the perceptual convictions about a brand’s property, advantage, and disposition affiliations, which are much of the time seen as the motivation for a broad valuation of, or awareness of the brand. In this way, brand image, which is a comprehensive mount from a gestalt of all the brand connections associated with the brand, is not identical to brand demeanor, which is a buyer’s broad valuation of the brand. Repeatedly confused for brand image, brand demeanor is abstracted as the only affiliation utilized in the management of the brand image.
Brand equity is a typically initiated development impacted by the image and attitude of the consumers. Similarly, it is also undeniably impacted by different conceptions, for example, those presented by Aaker (1991). More specifically, it is useful to see brand equity as one-sided consumer activities toward an article, brand image as insights connected with the article, and brand attitude as an assessment of the object. Farquhar’s and Keller’s thoughts on brand equity demonstrate that they accept, that brand equity is impacted by a good assessment of the brand.
Connections between buyers’ probability of intentionally buying products’ replicas and their attitude towards brand equity were researched in previous research. Since counterfeit products are one sort of brand name item, it is believed buyers’ attitudes toward brand equity and their eagerness to buy counterfeit products are connected. Brand value is well-defined as “a bunch of brand resources and accountabilities connected to a brand, its title, and symbol that include to or deduct from the worth given by a product or services to a firm as well as to that company’s purchasers (Aaker, 1991)”
Following Aaker (1991), five brand equity assets are the foundation of value creation such as brand awareness, brand image, brand quality, brand loyalty, and brand linkages. In the current research, these brand equity assets are the focus of this study. It was predicted that consumers’ probability of willingly buying counterfeit products and their attitude has a positive link with brand awareness, brand loyalty, and brand linkages. Whereas, a negative linkage was predicted between consumers’ probability of willingly buying counterfeit products and their attitude.
If a consumer wants a high-quality product, then he will not prefer to buy counterfeit products. Similarly, those consumers who are loyal to brands, have a positioning link with a brand or have awareness of the brand, buy branded products, and don’t prefer the counterfeit product. When consumers are not able to buy high-price-branded products, there is a chance of shifting demand to counterfeit products.
Figure no.1 Conceptual Framework
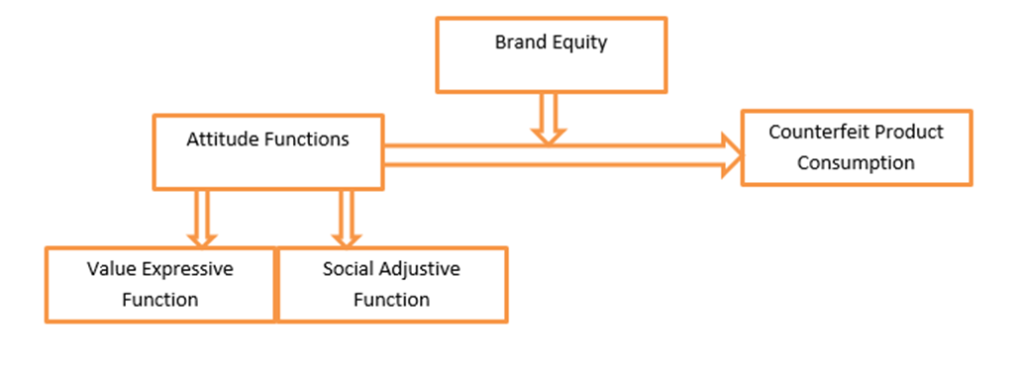
HA1: VE attitude function influences CPC.
HA2: Brand equity (BE) moderates the link between the VE attitude function and CPC.
HA3: SA attitude function influences CPC.
HA4: BE moderates the link between SA and CPC.
According to Burns and Grove (2009), a research strategy is a graph for replying to the research query or study hypothesis. In simple words, it is the outline or guidance for the arrangement, execution, and examination of research. Research strategy differs as per quantitative research design or qualitative research design. The core purpose of a descriptive design is to illustrate the fact that the VE and SA attitude function toward CPC has the moderating role of brand equity in the context of Pakistan. In this study, the examiner attained demographic data of the participants and recognized the causes and traits that visibly confirmed which age group draws more attention toward counterfeit product consumption.
It is expressed by (Burns and Grove; 2009) in their study that exploratory research observes the significant factors in detail to reach a suitable account of the realism of the present state. Exploratory research examines the area which was not analyzed previously and determines new facts, new perceptions, new thoughts, and new implications, and investigates the moderating impact of brand equity between the link of value-expressive and social adjectives function of attitude with counterfeit product consumption.
Brand equity moderates the relationship of two attitude functions as SA and VE with CPC in Pakistan have not been studied up till now; therefore this research is the first study and it prefers the quantitative method by employing a close-ended survey questionnaire with the intention of focus on the major aspects and identifies causes to that can be utilized as a foundation of future studies.
The targeted population identified in the research is all those females who purchase counterfeited clothing brands in the city of Karachi-Pakistan.
The consumers who reside in the urban part of Pakistan were selected to participate in this research; which means a total of 100 consumers are the sample of this study. So, in previous studies, the sampling method is considered apt since it emphasizes specific features of a population that are of concern and facilitate the researcher to respond to the research queries as they are all obsessed with luxury products.
Those who have willingly purchased counterfeit clothing products in urban Pakistan are entitled to be a part of this research survey. The willingness of participants to take part in the study is another inclusive criterion. The exclusion criteria do not want to participate, and females who never buy counterfeit clothing brands. Consumers who do not buy counterfeit products willingly. The study was conducted online. The e-questionnaire was filled out by participants.
Data gathering is the procedure of garnering related info from all the authentic sources to seek out the responses to the research query, analysis of the hypothesis, and assess the results. (Bryman, 2008). In the quantitative type of research, the deductive research method is generally applied (Wilson 2010), hence the data-gathering technique applied in this study was founded on deductive reasoning, since this method created the probabilities to (1) give details about causative relations between theory and variables, (2) to gauge the theory quantitatively, and lastly (3) to spread findings of the research to some degree (Burn and Grove 2009). Furthermore, this method commune with the objectives and goals of this study intended to ascertain the moderating variable effect of the BE in between the link of VE and SA with CPC in Pakistan. Burn and Grove (2009) state that a self-prepared questionnaire is utilized to apply the deductive approach.
A self-created close-ended questionnaire was used in this study. Questionnaires were sent through email and WhatsApp. The dialect of the questionnaire was English (Given in Appendix).
The questionnaire reflects the finest data-garnering tool for undertaken research because it allows the scholar to ask the counterfeit products’ consumers about the VE, SA functions of attitude, obsession towards counterfeit luxury brands, and moderating role of brand equity. In addition, the questionnaire was not costly as the researcher sent it via email and WhatsApp.
In this viewpoint, the key objectives of this thesis are; (1) To inspect the impact of VE on CPC. (2) To discover the impact of SA on CPC. (3) To identify the moderating variable role of BE on the connection between VE and CPC. (4) To search the moderating role of BE on the connection between SA and CPC.
Anonymity and Privacy
The statement in the questionnaire confirmed that the privacy of the participants would be safe. The motive for adopting this approach was to make it inaccessible for any outside party to recognize the participant of this study.
Validity and Reliability
The main pointers of the excellence of a research measuring tool are its reliability and validity. The procedure of mounting and validating a tool is mainly concentrated on dropping errors in the procedure of measurement. Reliability is identified as assessing the constancy of measures, the inner steadiness of measurement tools, and the analyst reliability of tool scores.
Validity is the degree to which the elucidations of the outcome of a test are necessary, based on the specific application of the test proposed to provide. The substance of the tool is significant in validity testing (Nieswiadomy 2010). In line with, Yu W et al., (2013) one can improve the content validity of the research tool by employing it in their research.
With the intent to assure construct validity, the details of the quantitative research-based questionnaire, comprised of close-ended questions were juxtaposed that structured as a vital share of the literature assessment. Indubitably, the survey tool of Yu W et al., (2013) was used as an outline for the developing questions; it supported in verifying the construct validity. Moreover, reliability reveals a notch in which results achieved by measurement and procedure can be counterfeit. Alpha reliability has criteria from 0 to 1 and in universal ≤, 0.6 is seen as the least quantity of acquiescent alpha for a measurement gauge.
Procedure
The close-ended survey questionnaires were sent via email and WhatsApp group and requested participants to fill out the questionnaire in a week. An explanation regarding how to complete every division of the questionnaire was provided to respondents.
The difficulty in getting back the finalized questionnaires was acknowledged whether the respondents might not respond within a time limit or decide not to retort. Though, the redeployment of the questionnaire was not done as the participants were unknown. After passing a week, the retort percentage was only 65.25%.
Compendium of Measurements applied in this Study
Descriptive statistics contain brief and systematized data intended to be understandable. It aims to characterize the data but does not extrapolate any conclusions about the overall population from the sample data. Typically, descriptive statistics use samples to describe data. This often signifies that descriptive statistics were not developed based on probability theory, in contrast to inferential statistics.
The chief sorts of descriptive statistics are used for accessing the central tendency. The average, or the figure around which the whole data set is distributed, shows the data set’s central tendency. It is the sole figure capable of determining the worth of the full collection of data in this way. Table No. 1 shows that 4.3960 is the average figure for the counterfeit product (CFP) data, suggesting that the sample of 100 consumers on average consumes 4.3960 counterfeit products. In contrast, the average values for BE, VE attitude function, and SA attitude function are 4.5900, 4.3100, and 4.2775 respectively.
Standard deviation (SD) is a measure of dispersion and it refers to the mean distance between every magnitude and mean value. In other words, it is the deviation of data from the mean value. If the standard deviation value is low, it identifies data is close to the mean value, while a large standard deviation indicates that the data set is scattered throughout a broader range of values. Table no.1 shows that the SD value for CFP consumption is 1.41991. This is a bit larger than average compared to the mean, indicating that the sample of 100 customers’ consumption of CFP is equally dispersed. Similarly, the standard deviation of BE, VE, and SA attitude functions are 1.16, 1.6, and 1.73 in the order.
| Table no.1 Descriptive Statistics | |||||
| N | Minimum | Maximum | Mean | SD | |
| VEF | 100 | 1.00 | 7.00 | 4.3100 | 1.69451 |
| SAF | 100 | 1.00 | 7.00 | 4.2775 | 1.73892 |
| CFP | 100 | 1.00 | 7.00 | 4.3960 | 1.41991 |
| BE | 100 | 1.40 | 6.80 | 4.5900 | 1.16632 |
| Valid N (listwise) | 100 | ||||
The model summary results expose the strength of the association of the dependent variable with the model. The multiple correlation coefficient displays the linear linking between the experiential values and model anticipated values of the dependent variable. If it stipulates the big value it illustrates a robust relationship. Model summary (table no.2) of HA1 & H A2 demonstrates that 68.7% is total variance in CPC is because of the VE function of attitude whereas after including the moderating role of BE the model is improved and shows 75.5 % is total variance in CPC because of VE function of attitude is elucidated by the moderating role of BE.
| Table no.2 Model Summary | |||||
| Model | R | R Square | Adjusted R Square | Std. The error in the Estimate | Durbin-Watson |
| 1 | .687a | .472 | .466 | 1.03715 | |
| 2 | .755b | .571 | .562 | .94006 | 1.727 |
| a. Predictors: (Constant), VEF | |||||
| b. Predictors: (Constant), VEF, VEFxBE | |||||
| c. Dependent Variable: CPC | |||||
Below is the results of correlation which has the degree that recognizes the indentation to which the movement of two unique variables is allied. In table no.3, the outcomes expose that an inclination of the VE attitude function would by 1 unit, upsurging the counterfeit product consumption by 0.687. While the moderating role of brand equity with the VE attitude function increases the counterfeit products’ consumption by 0.755.
| Table no.3 Correlations | ||||
| CPC | VEF | VEFxBE | ||
| Pearson Correlation | CPC | 1.000 | .687 | .755 |
| VEF | .687 | 1.000 | .914 | |
| VEFxBE | .755 | .914 | 1.000 | |
| Sig. (1-tailed) | CPC | . | .000 | .000 |
| VEF | .000 | . | .000 | |
| VEFxBE | .000 | .000 | . | |
| N | CPC | 100 | 100 | 100 |
| VEF | 100 | 100 | 100 | |
| VEFxBE | 100 | 100 | 100 | |
An ANOVA test is a statistical technique to identify the significance of the results. In definitive words, ANOVA assists you to figure out the acceptance and rejection of the null hypothesis. One-way ANOVA is used when there is only one predictor, in contrast, two-way ANOVA is utilized when there are two or above two predictors. There is more than one independent variable in this research study, there is a reason, and I apply two-way ANOVA.
The null hypothesis of two-way ANOVA specifies that no variation encompassing by means in group. If any group mean disperses substantially, the ANOVA outcome shows a statistically noteworthy results.
Table no.4 shows ANOVA results which show that the sig. value of model 1 which appear as less than 0.05, demonstrating that the null hypothesis is nullified. On the other hand, all group means showing that there is a substantial link present between CPC and VE function of attitude.
In model 2, the moderating role of BE has a significant influence on the linkage between the VE function of attitude and CPC.
| Table no. 4 ANOVA | ||||||
| Model | Sum of Squares | df | Mean Square | F | Sig. | |
| 1 | Regression | 94.183 | 1 | 94.183 | 87.557 | .000b |
| Residual | 105.416 | 98 | 1.076 | |||
| Total | 199.598 | 99 | ||||
| 2 | Regression | 113.878 | 2 | 56.939 | 64.431 | .000c |
| Residual | 85.721 | 97 | .884 | |||
| Total | 199.598 | 99 | ||||
| a. Dependent Variable: CPC | ||||||
| b. Predictors: (Constant), VEF | ||||||
| c. Predictors: (Constant), VEF, VEFxBE | ||||||
Table no.5 is presenting that without the moderating role of brand equity, the VE attitude function has a momentous and optimistic linkage with counterfeit products, particularly when the VE attitude function increases by 1 unit, it surges the significant incline in a unit of CPC by 0.687. However, the result is exemplifying the important influence of brand equity between the associations of VE attitude function and CPC.
| Table no. 5 Coefficientsa | ||||||||
| Model | Unstandardized Coefficients | Standardized Coefficients | t | Sig. | Collinearity Statistics | |||
| B | Std. Error | Beta | Tolerance | VIF | ||||
| 1 | (Constant) | 1.915 | .285 | 6.727 | .000 | |||
| VEF | .576 | .062 | .687 | 9.357 | .000 | 1.000 | 1.000 | |
| 2 | (Constant) | 2.396 | .277 | 8.637 | .000 | |||
| VEF | -.019 | .138 | -.022 | -.137 | .892 | .164 | 6.100 | |
| VEFxBE | .101 | .021 | .776 | 4.721 | .000 | .164 | 6.100 | |
| a. Dependent Variable: CPC | ||||||||
Table no.6 is the model summary of HA3 And HA4, it is demonstrating that 56.2% percent of the total variance in CPC is explained by the SA function of attitude, whereas, model 2 displays that 69.7% of the total variance in CPC because of SA function is described by the moderating role of BE.
| Table no. 6 Model Summary | |||||
| Model | R | R Square | Adjusted R Square | Std. Error of the Estimate | Durbin-Watson |
| 1 | .750a | .562 | .558 | .94410 | |
| 2 | .835b | .697 | .691 | .78966 | 1.835 |
| a. Predictors: (Constant), SAF | |||||
| b. Predictors: (Constant), SAF, SAFxBE | |||||
| c. Dependent Variable: CPC | |||||
The ANOVA results in table no.7, display that the significance value is below 0.05, elucidating the null hypothesis is vetoed and there is momentous relation exists between a dependent variable that is CPC, and the predictor namely SA.
| Table no. 7 ANOVAa | ||||||
| Model | Sum of Squares | df | Mean Square | F | Sig. | |
| 1 | Regression | 112.249 | 1 | 112.249 | 125.934 | .000b |
| Residual | 87.350 | 98 | .891 | |||
| Total | 199.598 | 99 | ||||
| 2 | Regression | 139.112 | 2 | 69.556 | 111.545 | .000c |
| Residual | 60.486 | 97 | .624 | |||
| Total | 199.598 | 99 | ||||
| a. Dependent Variable: CPC | ||||||
| b. Predictors: (Constant), SAF | ||||||
| c. Predictors: (Constant), SAF, SAFxBE | ||||||
Table no.8 is illustrating that without moderating role of BE, the SA has a crucial positive connection with CPC, in simple words when the VE attitude function raises by 1 unit, it proliferates the unit of CPC by 0.612 units significantly. While the finding is elucidating the significant impact of BE on the relations between the SA attitude function and CPC.
| Table no.8 Coefficientsa | ||||||||
| Model | Unstandardized Coefficients | Standardized Coefficients | t | Sig. | Collinearity Statistics | |||
| B | Std. Error | Beta | Tolerance | VIF | ||||
| 1 | (Constant) | 1.777 | .252 | 7.057 | .000 | |||
| SAF | .612 | .055 | .750 | 11.222 | .000 | 1.000 | 1.000 | |
| 2 | (Constant) | 2.165 | .219 | 9.899 | .000 | |||
| SAF | .017 | .102 | .021 | .170 | .865 | .202 | 4.946 | |
| SAFxBE | .106 | .016 | .816 | 6.564 | .000 | .202 | 4.946 | |
| a. Dependent Variable: CPC | ||||||||
In the below table no.9, the outcomes expose that an inclination of social expressive attitude function would by 1 unit, upsurges the counterfeit product consumption by 0.750. While the SA attitude function increases the counterfeit products’ consumption by 0.835 with the moderating role of brand equity.
| Table no. 9 Correlations | ||||
| CPC | SAF | SAFxBE | ||
| Pearson Correlation | CPC | 1.000 | .750 | .835 |
| SAF | .750 | 1.000 | .893 | |
| SAFxBE | .835 | .893 | 1.000 | |
| Sig. (1-tailed) | CPC | . | .000 | .000 |
| SAF | .000 | . | .000 | |
| SAFxBE | .000 | .000 | . | |
| N | CPC | 100 | 100 | 100 |
| SAF | 100 | 100 | 100 | |
| SAFxBE | 100 | 100 | 100 | |
The two-tailed findings of correlation in table no. 10, illustrate that VE and SA functions of attitude devise a substantial affirmative association with counterfeit product consumption. Brand equity is also signifying the considerable positive connection with counterfeit product consumption and it displays a robust link with CPC as compared to the VE attitude function and SA attitude function.
| Table no.10 Pearson Correlations | |||||
| VEF | SAF | CPC | BE | ||
| VEF | Pearson Correlation | 1 | .806** | .687** | .441** |
| Sig. (2-tailed) | .000 | .000 | .000 | ||
| N | 100 | 100 | 100 | 100 | |
| SAF | Pearson Correlation | .806** | 1 | .750** | .345** |
| Sig. (2-tailed) | .000 | .000 | .000 | ||
| N | 100 | 100 | 100 | 100 | |
| CPC | Pearson Correlation | .687** | .750** | 1 | .651** |
| Sig. (2-tailed) | .000 | .000 | .000 | ||
| N | 100 | 100 | 100 | 100 | |
| BE | Pearson Correlation | .441** | .345** | .651** | 1 |
| Sig. (2-tailed) | .000 | .000 | .000 | ||
| N | 100 | 100 | 100 | 100 | |
| **. Correlation is significant at the 0.01 level (2-tailed). | |||||
Conclusion and Recommendation
In early studies, it was disclosed that two functions of attitude work as key drivers in understanding buying behavior of consumers for counterfeited and original brand products. These attitude functions are known as the VE function of attitude and SA function of attitude. The one who possesses these two attitudes wish for using famous luxury brands and then they use counterfeit products of those brands. Counterfeit products can be a result of customers’ demand to show themselves belong to high status.
The moderating role of brand equity in the linkage of attitude functions such as the SA function of attitude and the VE function of attitude with CPC is studied in the context of Pakistan. This has not been studied up till now; therefore this research is the first study and it prefers the quantitative method by employing a close-ended survey questionnaire to focus on the major aspects and identify causes that can be utilized as a foundation of future studies.
The consumers who resided in Pakistan were selected to participate in this research; which means a total of 100 consumers are the sample of this study. So, in previous studies, the applied sampling method is considered apt since it emphasizes specific structures of a population and which facilitates the researcher to respond to the research queries as they are infatuated with branded products.
The questionnaire as a data collection instrument is the best for this study as it permits the researcher to ask the CPC about VE, SA functions of attitude, BE, and CPC. In addition, it is mentioned to the respondents that their privacy would not be shared. No external party can identify the respondent.
It has been found that brand equity moderates both the relationship such as the relation between VE function and CPC and between the SA function and CPC. Moreover, the inclusion of the BE variable improves the R square of the models.
There are certain boundaries of this study are (i) The research is bounded to CPC, (ii) the research study is not involved unaware consumers, (iii) the study is bounded to those consumers who reside in urban parts of Pakistan, and (iv) a limited number of participants were selected because of some constraints such as time constraints, budget constraints, and resource constraints.
In the future, the impact of two functions of attitude on consumers’ purchasing for different sorts of CPC can be studied. Additionally, it may be inspiring to compare preferences of branded products at different points in time or at different places, for example, the sample of this research can be compared to a sample from a previous generation or to a sample of different cities’ consumers. By conducting this kind of study, the researcher can recognize whether attitude functions have a more effect on the consumption of counterfeit products than on demographic grounds.